
Cheap Growth Got Expensive
Cheap Growth Got Expensive
01. THE UNCOMFORTABLE OPENING
In 2015, eBay ran an experiment most companies are too scared to run. They turned off their branded paid search. Stopped bidding on the word "eBay." The prediction from the marketing team was a bloodbath.
Almost nothing happened. Traffic and sales held. Organic search absorbed nearly every click the ads had been buying. The finding was published in Econometrica by Blake, Nosko and Tadelis, and it has been quietly ruining marketing budgets ever since.
Adidas learned the same lesson the expensive way. Their media director, Simon Peel, admitted publicly in 2019 that the company had been running roughly 77% performance and 23% brand and discovered during an AdWords outage in Latin America that pausing paid search didn't dent revenue. Brand-building was driving the majority of sales. Including e-commerce sales.
Key Takeaway:
Google's own researchers found that when an advertiser already holds the top organic result, only about half of their paid search clicks are incremental. You are the top organic result for your own company name. Which means a meaningful chunk of what your dashboard reports as "acquisition" is you buying customers who were already walking through your door.
You didn't get worse at marketing. Your scoreboard is lying to you.
02. WHAT ACTUALLY CHANGED
Three things broke at once, and none of them are your fault.
1. Attribution went dark
Apple's App Tracking Transparency turned tracking into an opt-in, and 75–85% of iOS users said no. Meta's CFO told investors on the Q4 2021 earnings call that Apple's changes would cost the company roughly $10 billion in 2022 ad revenue. Multi-touch attribution now sees a fraction of what it saw in 2020. Your CAC didn't necessarily spike. Your ability to see it collapsed, and the difference looks identical on a dashboard.
2. The inputs got more expensive
Triple Whale's 2025 analysis across 18,000+ brands: median Google Ads ROAS down 10% to 3.68, median cost per acquisition up 12% to $23.74, median CPM up 10%. Meta CPMs rose roughly 18–20% year over year. On the DTC side, SimplicityDX found merchants lost an average of $9 per new customer in 2013 and $29 by 2022 — a 222% increase in acquisition drag over eight years.
3. The free channel stopped being free
Pew Research analyzed 68,879 real searches and found users click a traditional result 8% of the time when an AI summary appears, versus 15% when it doesn't. Ahrefs measured a 58% drop in position-one click-through where AI Overviews are present. Bain reported in February 2025 that 60% of searches now end without a click to any website, cutting organic traffic 15–25%.
And cold email?
Reply rates fell from about 8.5% in 2019 to roughly 3.4% by 2026 across billions of measured interactions. Belkins, using strict methodology that strips out open-pixel inflation, puts the true average reply rate at 0.45%.
Four hundred and forty-four emails per reply. That's not a channel. That's a slot machine.
03. THE MECHANISM
Here's why this happened, and it isn't a marketing problem. It's an economics problem.
A signal only carries information if it's expensive to fake.
This comes out of biology — Zahavi's handicap principle (1975) — and out of economics, where Spence won a Nobel for signaling theory. Kirmani and Wright brought it into advertising in 1989 with a Journal of Consumer Research paper called "Money Talks," running six experiments showing that buyers read perceived advertising expense as a proxy for quality. Rory Sutherland says it more cleanly than any academic: the significance we attach to a message is proportional to the expense with which it was communicated.
Generative AI drove the marginal cost of producing a professional-looking message to approximately zero. So the message stopped meaning anything.
Not because it's bad. Because it's cheap, and your buyer's pattern-recognition has already priced that in. Gartner surveyed 632 B2B buyers in late 2024 and found 73% actively avoid suppliers who send irrelevant outreach. Not ignore. Avoid. You are now paying to be disqualified.
Meanwhile, what still gets through is what can't be faked cheaply. SurveyMonkey and Reddit's decision-maker research found peer recommendations trusted at 73% ahead of vendor websites at 55%, search at 54%, review sites at 46%, AI chatbots at 39%, and social at 36%.
The gap between 73% and 36% is your entire go-to-market strategy.
04. WHERE MOST OPERATORS GET THIS WRONG
Now the part where I break my own argument, because you deserve the whole picture and not a sales pitch dressed as analysis.
"Costly signals work" is not a license to spend. Kirmani's own follow-up research in 1990 and 1997 found the relationship is an inverted U. Moderate-to-high perceived expense reads as strength. Past a threshold, it reads as desperation, and buyers flip into skepticism — why are they trying this hard? The gold-plated dinner doesn't beat the good dinner. It loses to it.
Some of the effect size is softer than the internet claims. Buell and Norton's "labor illusion" research in Management Science found that visibly showing your work raises perceived value roughly 8%. Not 65%, which is a number that circulates online attached to no study at all. And a 2023 preregistered replication with 1,405 participants failed to find that effort raises the monetary value people assign to something. The mechanism is real. The magnitude is contested. Anyone quoting you a bigger number is selling.
Events fail more often than they succeed. CEIR reports a $20.98 return per dollar on trade show exhibiting, and cost per lead at $112 versus $259 for a field sales call. Fine. But cost per lead swings from $112 to $811 depending on the show, and industry research consistently finds the overwhelming majority of marketers believe their company fails to convert event leads into opportunities. Fewer than half of exhibitors even track leads through the sales cycle. A booth without a pre-booked calendar and a 48-hour follow-up standard is a tax-deductible vacation.
Offline ROI numbers are measured worse than digital ones. Direct mail's headline stat — 4.4% response versus email's 0.12% — is true and comes from ANA/DMA. It's also a response comparison, and email costs essentially nothing per contact. Per dollar, email frequently still wins. If I'm going to tell you digital ROAS is inflated, intellectual honesty requires me to tell you the direct mail number is soft too.
And if your paid economics still work, do not blow them up. If your blended CAC sits under roughly a third of your gross-margin LTV, and you can prove incrementality with a geo holdout, keep scaling. This entire article does not apply to you. Come back when it stops working.
05. THE REBALANCE
The answer isn't "quit digital." It's that you're allocated wrong.
Binet and Field's analysis of the IPA Databank — 996 case studies across 700 brands and 30+ years — produced the 60/40 rule: roughly 60% brand-building, 40% activation. WARC found budgets had drifted to 68.8% short-term performance, up from 59.9% the year prior. The whole market is over-indexed on the half that's easiest to measure.
For B2B it's sharper still. The 95:5 rule out of the LinkedIn B2B Institute and Ehrenberg-Bass: only about 5% of your buyers are in-market at any given moment. Ninety-five percent of your spend is landing on people who cannot buy today. Which means the job isn't conversion. It's being the obvious name when they finally are ready.
Three Moves. In Order:
Move 1 — Test what's actually incremental
Before you cut or add anything, run one geo holdout on your largest paid channel. Turn it off in one region for 30 days. Compare total revenue, not attributed revenue. You will likely find 20–40% of your reported ROAS is cannibalization of demand you already owned. That freed budget funds everything below. This costs nothing but nerve.
Move 2 — Buy one expensive signal you can actually afford
Pick one. Not five.
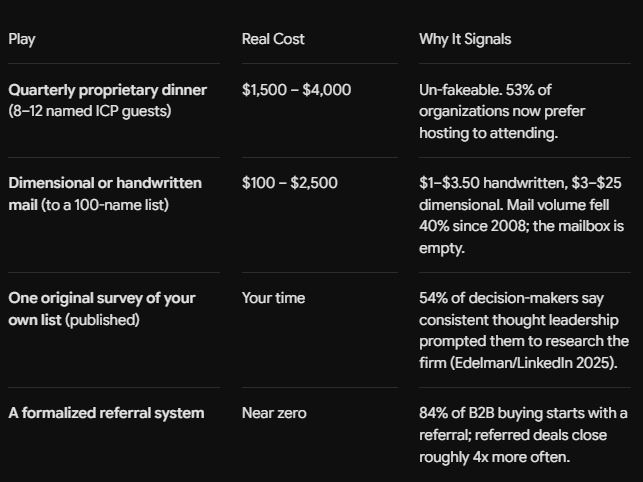
Move 3 — Prune, don't add
The classic failure is horizontal expansion: a little Meta, a little LinkedIn, a little SEO, a little outbound, no density anywhere. Kill the bottom two channels outright. Concentrate the recovered spend into the one signal from Move 2 until you own it.
06. THE OWNER'S NUMBER
Here's what this is really about, and it isn't marketing.
Every one of these expensive signals — the dinner, the survey, the referral system, the point of view — is currently sitting in your head. Which means the highest-signal asset your company owns is also the least transferable one. That's not a marketing gap. That's an owner-dependency discount, and it comes off your valuation the day you try to sell.
The work is building the system so the signal outlives your calendar.
Cheap growth got expensive. Expensive growth got rare. And rare is the only thing a buyer has ever paid a premium for.
About the Author & Next Steps
Jake Shannon is founder of No1 Coaching & Consulting and a two-time 10X Performance Coach of the Year. No1 installs revenue, management, and exit-readiness operating systems in founder-led companies doing $1M–$25M. Elite Cohort results to date: $11.34M+ revenue added, 978% average ROI, 54% average revenue growth.
If you want to know which of your channels are real and which are cannibalizing demand you already own, that's the first thing a Revenue Intelligence Audit measures. Start there.
