Digital Advertising is D.O.A… The Numbers Don’t Lie
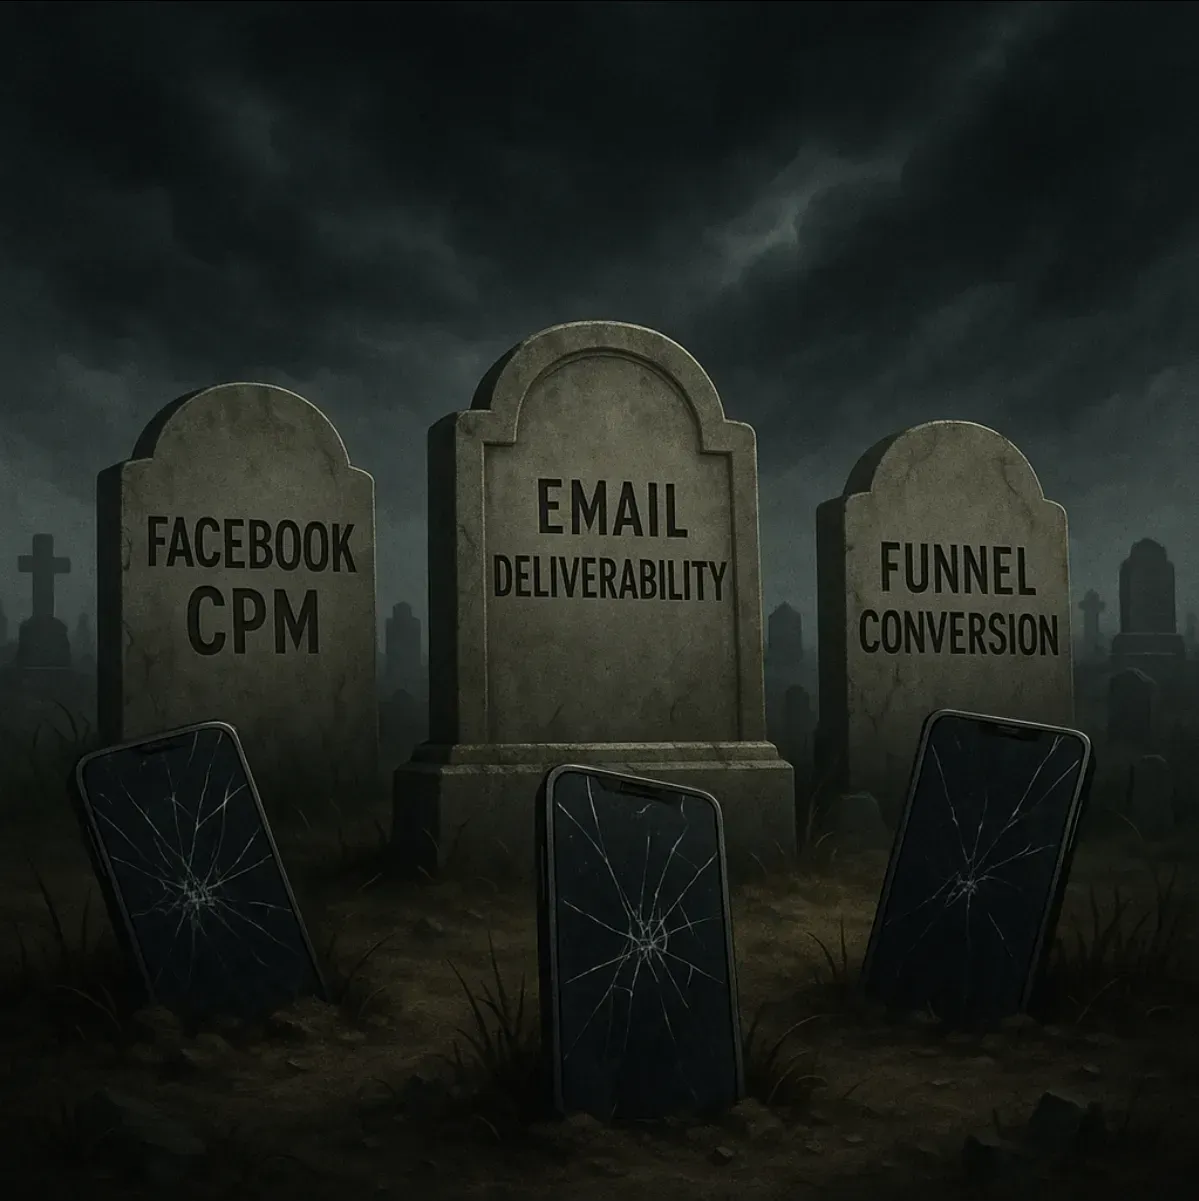
Listen up—if you’re still bankrolling Mark Zuckerberg’s next yacht with your ad budget, it’s time for a reality check. Digital advertising, as you knew it even two years ago, isn’t just broken. It’s fundamentally obsolete, and the cold, hard numbers prove it.
Facebook Ads: Skyrocketing Costs, Shrinking Returns
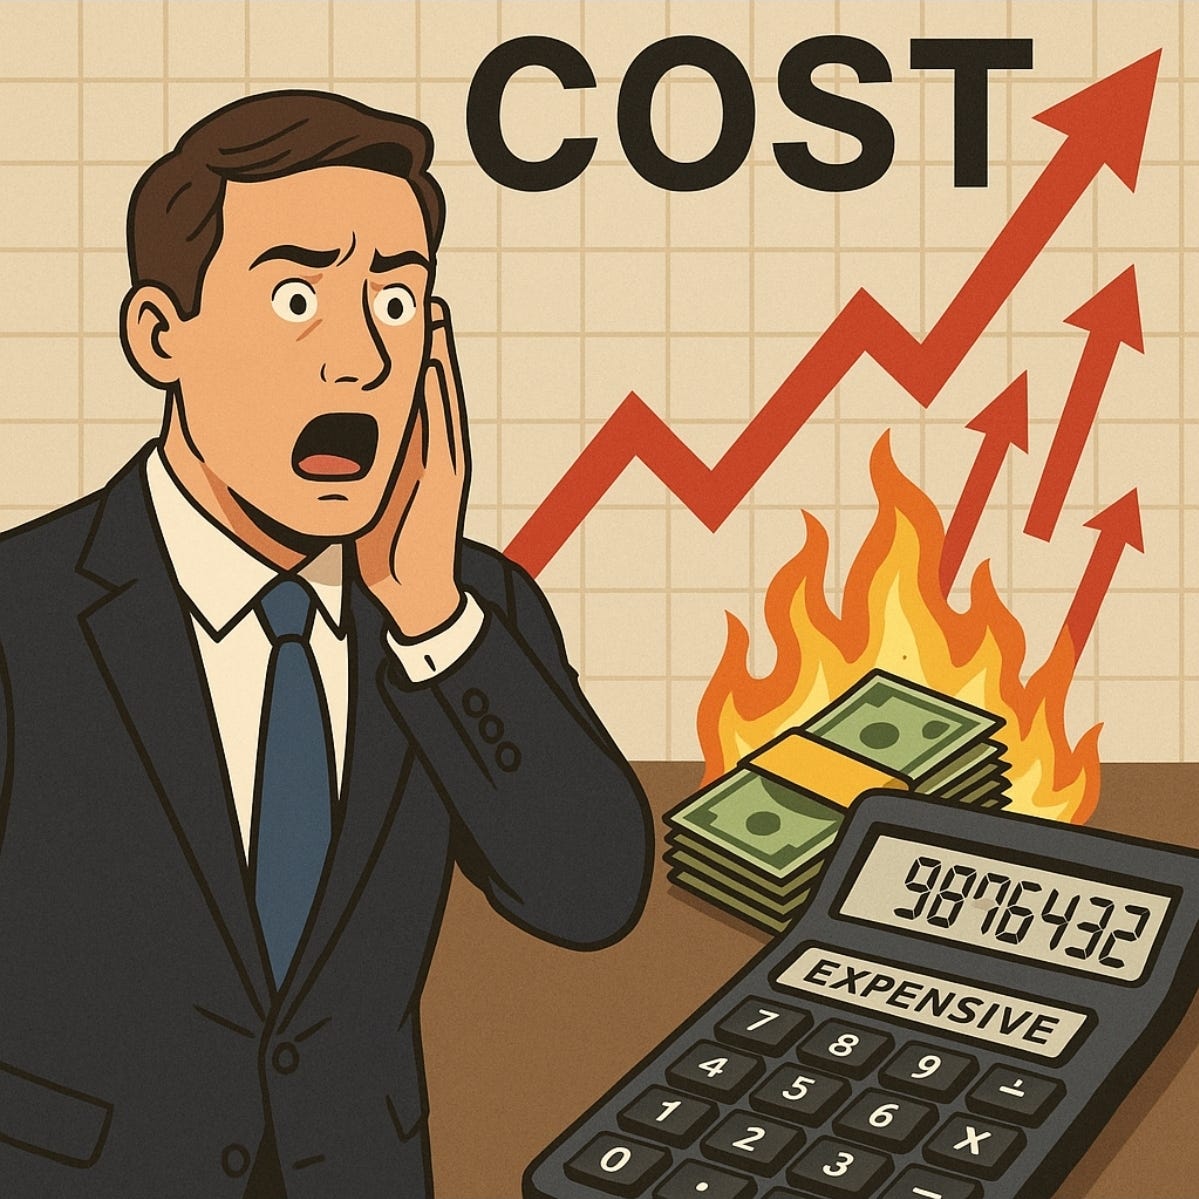
Let’s start with the basics. In 2025, the average Facebook CPM in the United States is over $20.48, with global averages ranging from $8.15 to $13.57, depending on region and industry[1][2][3][4][5]. Some platforms even report jumps of 150% or more compared to recent years[5]. Even the annual global benchmark across Facebook and Instagram puts CPM firmly above $8, and during seasonal surges, rates easily exceed $12–$13[2][3]. Compare that to the $2-3 CPMs of just a few years back. The days of cheap, high-ROI reach are gone.

Email Deliverability: Algorithms Are Closing the Door
Think you can pivot to email for the win? Think again. Advanced AI filters, engagement-based delivery, mandatory authentication, and tighter privacy rules have made deliverability a moving target. Inbox placement rates have fallen, and global benchmarks now hover around 80-83% for reputable senders, while less-optimized campaigns are substantially lower[6][7][8]. The simple reality: unless you’re rigorously focused on sender reputation, authentication (SPF, DKIM, DMARC), and engagement, most of your emails won’t even get seen.

Funnel Conversion Rates: Down to Earth
Conversion rates aren’t faring any better. The cross-industry average sales funnel conversion rate sits at just 2.35% as of 2025. If you’re elite—top decile—you might achieve over 5.3%[9][10][11]. But most funnels are leaking hard: optimized landing pages help, but the funnel drop-off from prospect to customer remains brutal.
Attribution and Tracking: iOS Privacy Revolution
iOS privacy updates triggered a cataclysm in the world of attribution. Apple’s strict restrictions on IDFA mean nearly 90% of users decline ad-tracking permissions [12]. That shatters advertiser access to granular targeting, lookalike audiences, and reliable user journey mapping. Your expensive “precision marketing” now flies blind in core channels, as Facebook and others scramble to patch legacy tracking with limited results [12][13].
Press enter or click to view the image in full size

The Trade Show Comeback: Real-WORLD ROI
While digital ad spend delivers unpredictable returns, live events are surging. The U.S. B2B trade show market hit $15.78 billion in 2024 and is set to surpass $17.3B by 2028, outpacing its pre-pandemic highs[14][15][16]. Attendance is up 15% year-over-year, in some verticals exceeding even the wildest expectations from before 2020[15]. And get this—81% of attendees have direct buying authority, and in-person conversion rates can be 72% higher than those of digital-first alternatives [14][15]. Trade shows aren’t just back; they’re thriving, delivering measurable, compound ROI.
What the Winners Are Really Doing

So, what’s working? The best don’t settle for tired tactics:
- They build advanced communication systems—personalized, adaptive, and relationship-driven, not spam blasts[6][8].
- They design content ecosystems that every channel supports, leveraging first-party data and community over CPM-driven buying[2][6].
- They profit from marketing volatility with chaos-resistant systems: redundancy, rapid iteration, and a multi-channel war chest[15][14].
- They put face-to-face events back at the center of acquisition—where budgets yield premium-qualified leads with real decision-making power[15][14].
Throw out the playbooks that counted on cheap ads, lazy attribution, and unopposed digital reach. Build tangible business assets instead: own your lists, nurture your champions, and dominate the platforms you can control.
This is not a theory. This is data. The future belongs to those who pivot, adapt, and build lasting, direct customer relationships instead of pouring capital into rising digital ad costs for ever-shrinking returns.
Citations
1)Lebesgue: AI CMO - Facebook Ads CPM by Country - Data from 2025
https://lebesgue.io/facebook-ads/facebook-cpm-by-country
Facebook CPM in the United States: $20.48 (2025)
2) Gupta Media - The True Cost of Social Media Ads in 2025
https://www.guptamedia.com/social-media-ads-cost
Meta (Facebook/Instagram) average CPM: $8.17 (June 2025)
3) Shopify - What Facebook Ads Cost in June 2025
https://www.shopify.com/blog/facebook-ads-cost
Average Facebook CPM: $12.74 (June 2025)
4) Madgicx - How Much Do Facebook Ads Cost in 2025
https://madgicx.com/blog/facebook-ads-cost
Average Facebook CPM in the United States: over $20
5) GlockApps - New Email Deliverability Statistics: Q2 2025
https://glockapps.com/blog/new-email-deliverability-statistics/
Email deliverability rates by major inbox providers increased in Q2 2025
6) EmailToolTester - Email Deliverability Statistics (2025)
https://www.emailtooltester.com/en/blog/email-deliverability-statistics/
Average email deliverability rate: 83.1% across 15 ESPs tested
7) Omnisend - Improve Email Deliverability: In-Depth Guide For 2025
https://www.omnisend.com/blog/email-deliverability/
Global average deliverability around 83%, with Gmail (95.54%), Microsoft (91.33%), Yahoo (81.33%)
8) Validity - 2023 Email Deliverability Benchmark Report
https://www.validity.com/wp-content/uploads/2023/03/2023-Email-Deliverability-Benchmark.pdf
Global inbox placement rates were just below 85% in 2022, approximately 1 in 6 emails never reach the inbox
9) Amra & Elma - Top Marketing Funnel Conversion Statistics 2025
https://www.amraandelma.com/marketing-funnel-conversion-statistics/
Average sales funnel conversion rate: 2.35%, top performers: 5.31%+
10) First Page Sage - Sales Funnel Conversion Rate Benchmarks: 2025 Report
https://firstpagesage.com/seo-blog/sales-funnel-conversion-rate-benchmarks-2025-report/
Sales funnel conversion benchmarks by industry and stage
11) First Page Sage - Average Conversion Rate by Industry & Marketing Channel
https://firstpagesage.com/seo-blog/average-conversion-rate-by-industry-marketing-channel/
Cross-industry conversion rates ranging from 1.1% to 3.8%
12) Adjust - ATT Opt-in Rates: 2025 Data & Benchmarks
https://www.adjust.com/blog/att-opt-in-rates-2025/
Industry-wide average ATT opt-in rate: 35% as of Q2 2025
13) Singular - ATT Opt-in Rates 2024: Down, Down, Down
https://www.singular.net/blog/att-opt-in-rates-2024/
ATT opt-in rates decreased to under 14% globally in mid-2024
14) Apple Magazine - App Tracking Transparency: Four Years Of Impact On User Privacy
https://applemagazine.com/app-tracking-transparency-cuts-u-s-tracking-rate/
App Tracking Transparency has cut U.S. tracking rates by 55% since 2021
15) ROI Revolution - Apple iOS 14.5: Impact on Ecommerce
https://roirevolution.com/blog/apple-ios-14-update-impact-on-ecommerce-brands/
IDFA sharing dropped from 70% to as low as 10% after iOS 14.5
16) Kollnig et al. - Goodbye Tracking? Impact of iOS App Tracking Transparency
https://facctconference.org/static/pdfs_2022/facct22-3533116.pdf
50.8% of apps could access IDFA pre-ATT vs 24.7% post-ATT
17) Giant Printing - 2025 Trade Show Statistics: Latest Trends & Data
https://giantprinting.com/trade-show-statistics/
U.S. B2B trade show market: $15.8B (2024), projected $17.3B (2028), 15% attendance increase
18) Triple20 - Are Trade Shows Still Worth It in 2025?
https://triple20.co/are-trade-shows-worth-it/
81% of trade show attendees have buying authority, 72% more likely to buy from exhibitors they met
19) Custom Market Insights - Convention and Exhibition Market Size
https://www.custommarketinsights.com/press-releases/convention-and-exhibition-market-size/
Global convention & exhibition market: $61.2B (2024) to $95.7B (2033), 5.1% CAGR
20) Event Marketer - Research: State of the B-to-B Events Industry
https://www.eventmarketer.com/article/data-on-b-to-b-events-industry-2025/
80% say in-person conferences critical to success, 78% most impactful marketing channel